JN Recap – Power-Play Stays Quiet and Bounces Cost Winnipeg in 4-1 Loss to Boston

By Sammi Silber
7 years agoNineteen seconds. That was the amount of time the Winnipeg Jets held a 1-0 lead, and after that, they wouldn’t score again. Not only did bounces not go the Jets’ way, but their power-play unit was dead silent.
Let’s talk about how they did overall.
Game Thoughts
Blake Wheeler scored a beauty of a breakaway goal to open the game on a positive note. Unfortunately, the team did not maintain momentum like it should have, and seconds later, the score was knotted at one. After that, Winnipeg looked unable to recover from Dominic Moore’s game-tying strike.
Despite the loss and underwhelming 44 percent in the faceoff dot, the Jets didn’t look too shabby. They outshot the Bruins 35-25, and also managed 24 hits against the big, bad Bruins. It was just unfortunate that the Bruins’ seemed to benefit from good puck luck, as well as outstanding play from Tuukka Rask between the pipes.
- The Jets spent too much time in the box Monday, especially during the third period. This not only forced Winnipeg to stay in their defensive zone but took away any kind of comeback opportunity going forward.
- At least, however, Winnipeg’s penalty kill looked good. They only allowed five shots on the power play, and Boston went 0 for 4, unable to make anything of their chances. In the end, they’d be lucky bounces that won them the game.
- When Winnipeg got their chance on the man advantage, they made nothing of it. However, the Jets did look a bit stronger and applied more pressure, putting 14 shots on net when they were 5 on 4. In the end, it led to nothing, but gave them more chances. On the contrary, they did surrender a shorthanded goal, which was not impressive by any means. Winnipeg is 1 for 13 this season after finishing dead last in power play success in 2015-16.
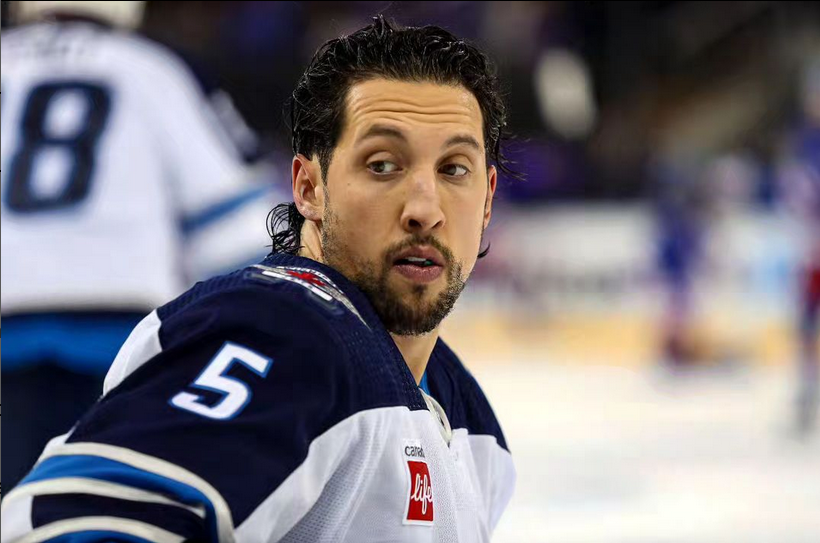
- Though Byfuglien skated 30:05 and continues to take on big minutes, he didn’t look too impressive Monday. Sure, he had four shots and five hits, but he was a minus-2 and gave away the puck four times. He also didn’t contribute much to the man advantage but skated 5:20 on the power play.
- Winnipeg seems to not like having Patrik Laine on the power play. Which I don’t really understand, considering he could probably be part of the solution to their scoring woes. He did, however, get nearly 20 minutes of ice time, managing two shots and two hits. The Jets should use him more.
- Connor Hellebuyck wasn’t the most impressive. He stopped all five shots faced when the Jets were on the penalty kill but surrendered 15 goals on 19 shots, including a shorthanded tally and two Chara strikes.
Your hot taeks
CHARTS N STUFF
All stats and charts courtesy of hockeystats.ca.

On Ice Events – Away Team – BOSTON BRUINS
| Player | All Situations | 5v5 Even Strength | ||||||||||
| # | Name | Position | Corsi For | Corsi Against | Corsi | Corsi For% | Zone Start% | Corsi For | Corsi Against | Corsi | Corsi For% | Zone Start% |
| 6 | COLIN MILLER | D | 20 | 9 | 11 | 68.97% | 85.71% | 14 | 7 | 7 | 66.67% | 80% |
| 11 | JIMMY HAYES | R | 11 | 11 | 0 | 50% | 45.45% | 11 | 11 | 0 | 50% | 45.45% |
| 20 | RILEY NASH | C | 12 | 22 | -10 | 35.29% | 37.5% | 12 | 15 | -3 | 44.44% | 60% |
| 25 | BRANDON CARLO | D | 14 | 28 | -14 | 33.33% | 26.09% | 13 | 16 | -3 | 44.83% | 35.29% |
| 26 | JOHN-MICHAEL LILES | D | 18 | 13 | 5 | 58.06% | 85.71% | 13 | 8 | 5 | 61.9% | 100% |
| 28 | DOMINIC MOORE | C | 11 | 16 | -5 | 40.74% | 38.46% | 9 | 8 | 1 | 52.94% | 71.43% |
| 33 | ZDENO CHARA | D | 18 | 28 | -10 | 39.13% | 26.92% | 15 | 15 | 0 | 50% | 35.29% |
| 39 | MATT BELESKEY | L | 18 | 15 | 3 | 54.55% | 57.14% | 13 | 10 | 3 | 56.52% | 50% |
| 40 | TUUKKA RASK | G | 46 | 58 | -12 | 44.23% | 40% | 35 | 34 | 1 | 50.72% | 46.88% |
| 42 | DAVID BACKES | R | 14 | 21 | -7 | 40% | 21.43% | 9 | 10 | -1 | 47.37% | 27.27% |
| 43 | DANTON HEINEN | C | 7 | 7 | 0 | 50% | 33.33% | 4 | 5 | -1 | 44.44% | 33.33% |
| 44 | ROB O’GARA | D | 9 | 17 | -8 | 34.62% | 46.15% | 8 | 10 | -2 | 44.44% | 50% |
| 46 | DAVID KREJCI | C | 8 | 9 | -1 | 47.06% | 33.33% | 5 | 6 | -1 | 45.45% | 33.33% |
| 47 | TOREY KRUG | D | 12 | 22 | -10 | 35.29% | 35.71% | 8 | 15 | -7 | 34.78% | 45.45% |
| 51 | RYAN SPOONER | C | 5 | 7 | -2 | 41.67% | 25% | 3 | 5 | -2 | 37.5% | 25% |
| 55 | NOEL ACCIARI | C | 12 | 10 | 2 | 54.55% | 85.71% | 11 | 6 | 5 | 64.71% | 83.33% |
| 59 | TIM SCHALLER | C | 11 | 5 | 6 | 68.75% | 80% | 11 | 3 | 8 | 78.57% | 100% |
| 63 | BRAD MARCHAND | C | 14 | 21 | -7 | 40% | 29.41% | 8 | 11 | -3 | 42.11% | 25% |
| 88 | DAVID PASTRNAK | R | 14 | 10 | 4 | 58.33% | 46.15% | 8 | 9 | -1 | 47.06% | 36.36% |
On Ice Events – Home Team – WINNIPEG JETS
| Player | All Situations | 5v5 Even Strength | ||||||||||
| # | Name | Position | Corsi For | Corsi Against | Corsi | Corsi For% | Zone Start% | Corsi For | Corsi Against | Corsi | Corsi For% | Zone Start% |
| 4 | PAUL POSTMA | D | 4 | 10 | -6 | 28.57% | 25% | 4 | 10 | -6 | 28.57% | 25% |
| 7 | BEN CHIAROT | D | 5 | 14 | -9 | 26.32% | 20% | 4 | 10 | -6 | 28.57% | 25% |
| 12 | DREW STAFFORD | R | 19 | 10 | 9 | 65.52% | 76.47% | 11 | 10 | 1 | 52.38% | 60% |
| 13 | BRANDON TANEV | L | 2 | 9 | -7 | 18.18% | 57.14% | 2 | 7 | -5 | 22.22% | 57.14% |
| 16 | SHAWN MATTHIAS | C | 3 | 13 | -10 | 18.75% | 44.44% | 3 | 8 | -5 | 27.27% | 57.14% |
| 17 | ADAM LOWRY | L | 9 | 13 | -4 | 40.91% | 44.44% | 3 | 7 | -4 | 30% | 57.14% |
| 26 | BLAKE WHEELER | R | 24 | 13 | 11 | 64.86% | 70% | 12 | 12 | 0 | 50% | 54.55% |
| 27 | NIKOLAJ EHLERS | L | 24 | 8 | 16 | 75% | 72.22% | 13 | 7 | 6 | 65% | 63.64% |
| 29 | PATRIK LAINE | R | 20 | 14 | 6 | 58.82% | 60% | 8 | 11 | -3 | 42.11% | 50% |
| 33 | DUSTIN BYFUGLIEN | D | 28 | 22 | 6 | 56% | 62.5% | 14 | 17 | -3 | 45.16% | 53.33% |
| 37 | CONNOR HELLEBUYCK | G | 55 | 45 | 10 | 55% | 59.09% | 34 | 35 | -1 | 49.28% | 51.61% |
| 39 | TOBY ENSTROM | D | 25 | 16 | 9 | 60.98% | 61.11% | 16 | 10 | 6 | 61.54% | 57.14% |
| 40 | JOEL ARMIA | R | 17 | 11 | 6 | 60.71% | 60% | 10 | 8 | 2 | 55.56% | 33.33% |
| 44 | JOSH MORRISSEY | D | 17 | 14 | 3 | 54.84% | 53.33% | 15 | 12 | 3 | 55.56% | 53.85% |
| 55 | MARK SCHEIFELE | C | 23 | 13 | 10 | 63.89% | 73.68% | 11 | 11 | 0 | 50% | 60% |
| 57 | TYLER MYERS | D | 20 | 12 | 8 | 62.5% | 60% | 15 | 9 | 6 | 62.5% | 61.54% |
| 81 | KYLE CONNOR | L | 18 | 10 | 8 | 64.29% | 60% | 9 | 9 | 0 | 50% | 33.33% |
| 85 | MATHIEU PERREAULT | C | 26 | 11 | 15 | 70.27% | 60% | 14 | 8 | 6 | 63.64% | 53.85% |
| 91 | ALEXANDER BURMISTROV | C | 6 | 9 | -3 | 40% | 33.33% | 6 | 9 | -3 | 40% | 33.33% |
TL;DR GIF RECAP
Recent articles from Sammi Silber