Hockey’s Forward Linkages: The predicted failure of the Leafs in perspective

10 years ago

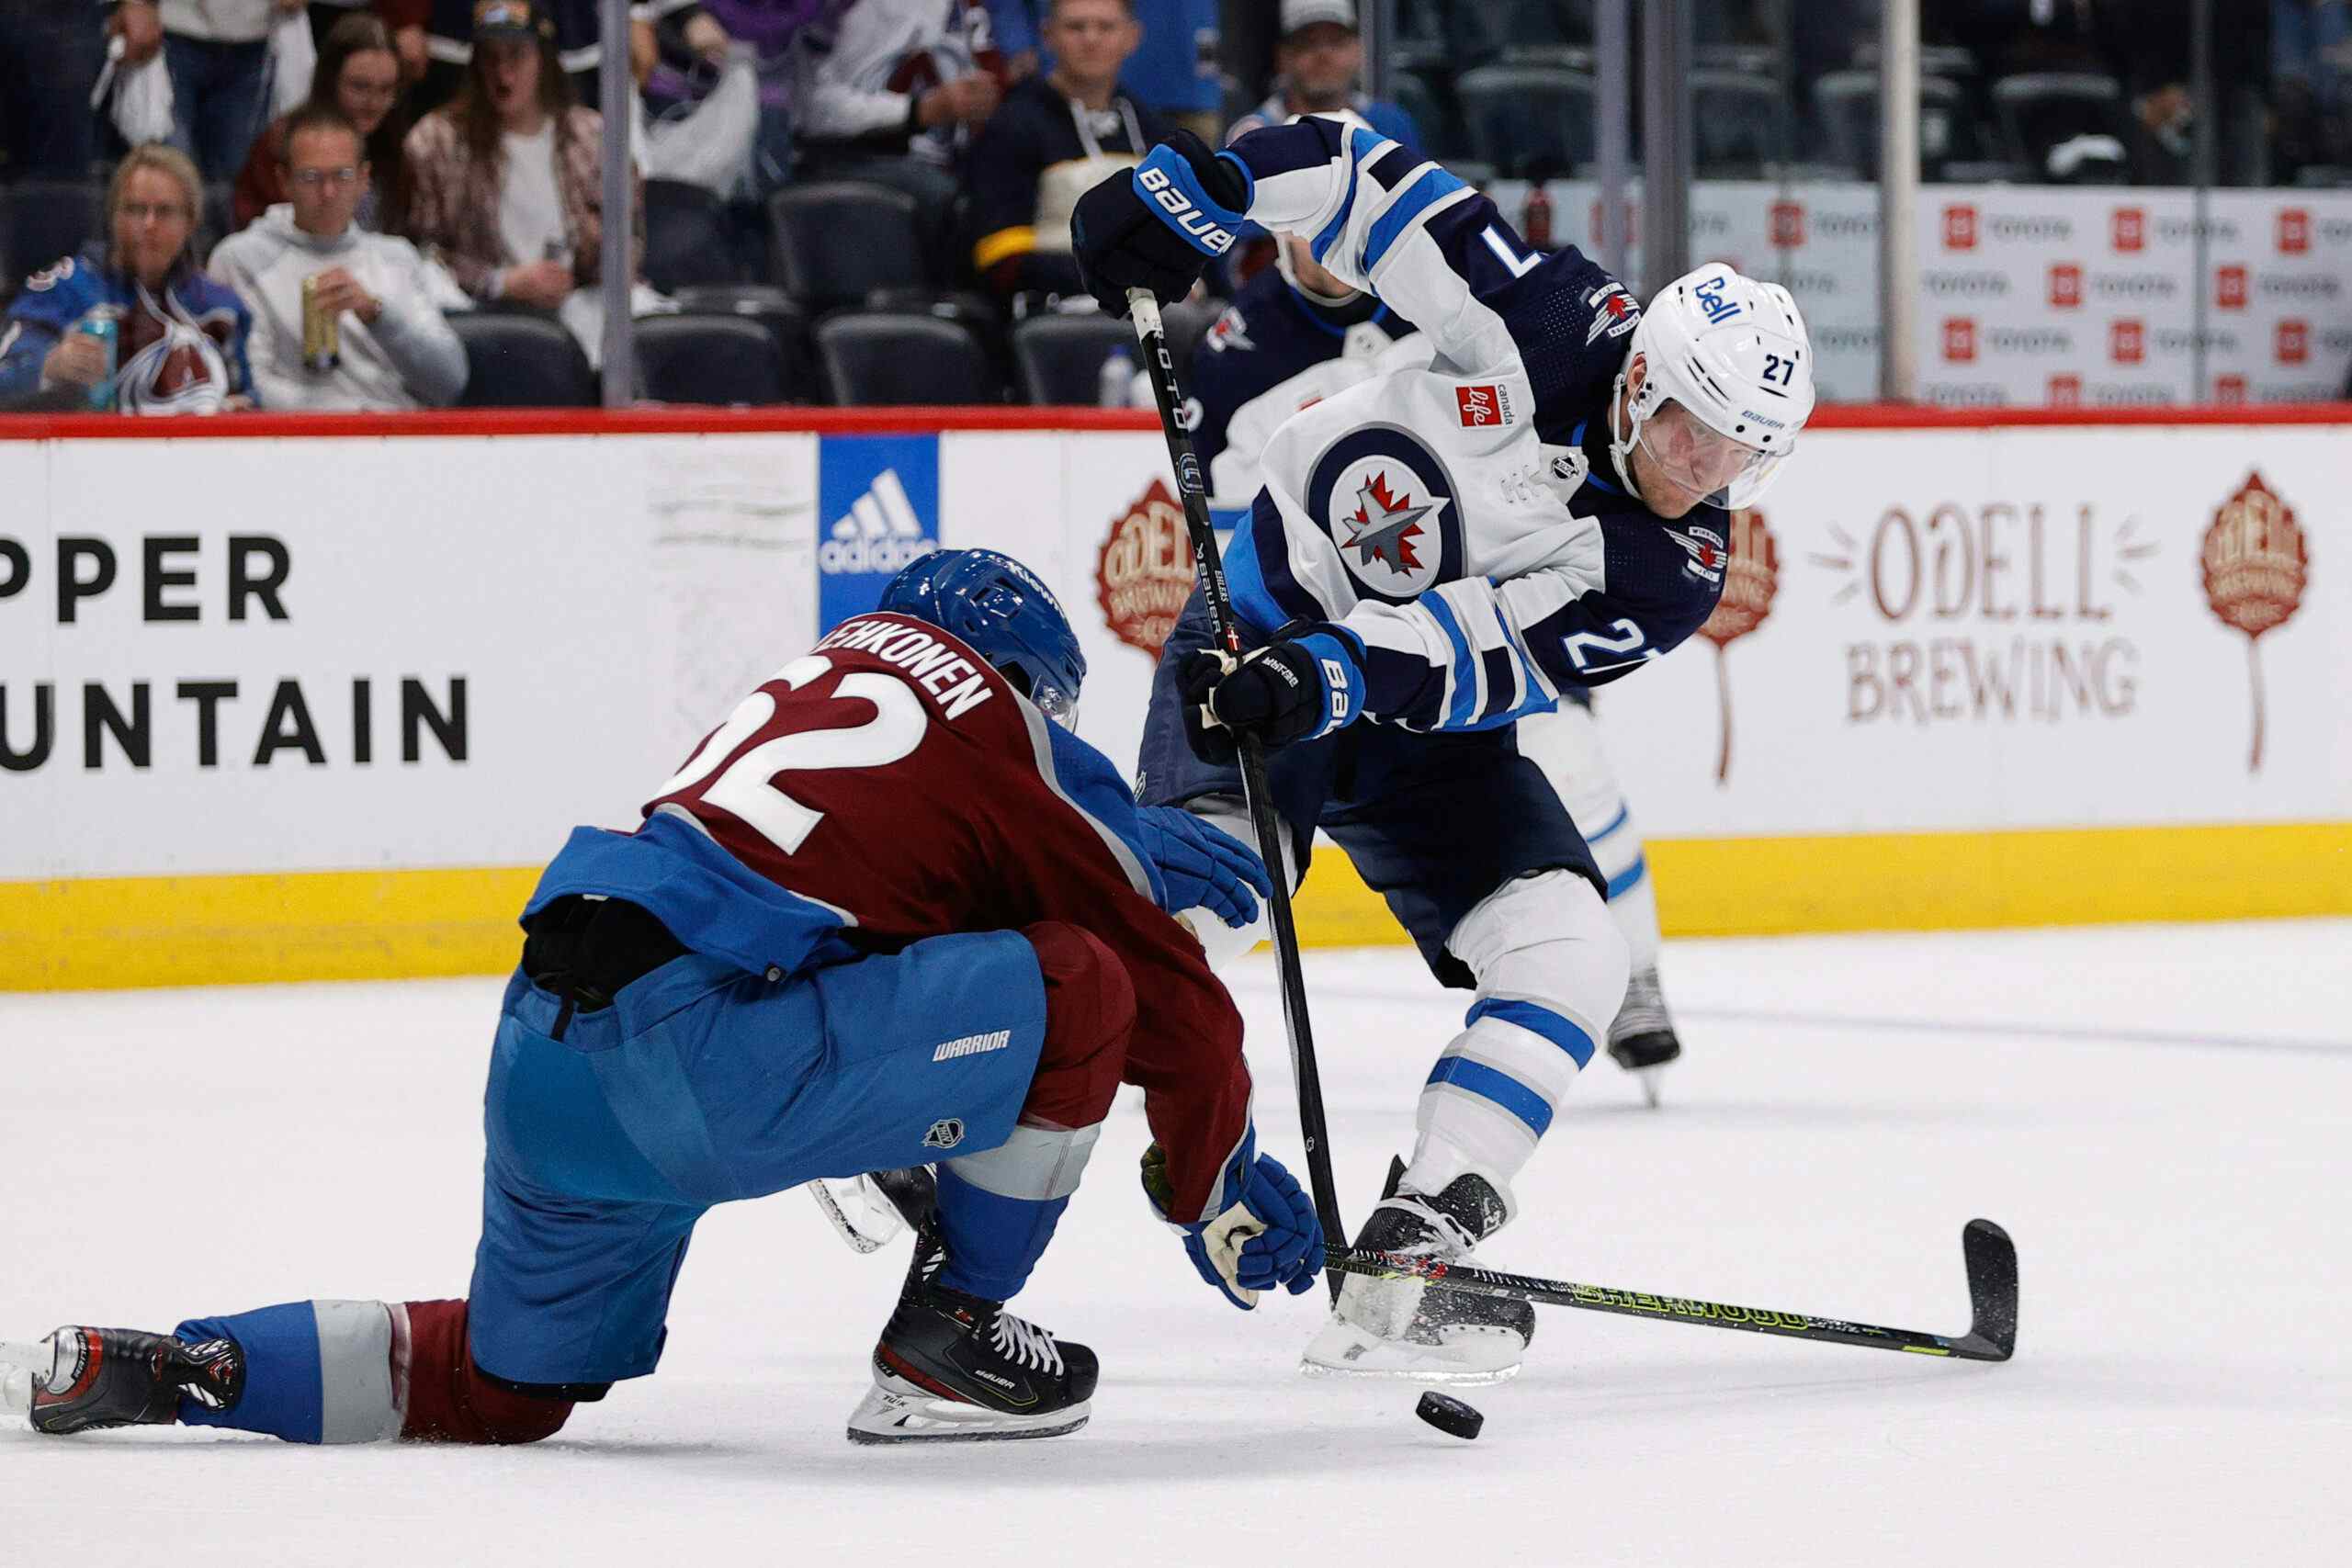
Photo by Shahid Bhinder
The hockey
world is in spasm at the moment. It is moving in many directions at once, with
those invested in any given direction actively claiming theirs should be called
‘forward.’ It can feel at times as though movements are connected – that the
future of violence in hockey, for instance, rests within the larger presumed paradigm
shift from positional, body-focused hockey to possession-based, puck-focused
hockey. More often than not, however, those connections are more personal than
real, hanging together by the nature of having electrified meat to do our
thinking.
In fact, insofar as a paradigm shift is underway at all (we’ll
unpack that later), it’s neither clear which analytics will change how the game
is played, nor what will happen to the honoured method of personal accounts to
evaluate players. More prominently, we can’t know what hockey will look like for
our children or grandchildren. It’s not the coordinated movement of a dance
troupe of Excel users. It’s a spasm.
In these moments, it’s important to study the process of change:
how we get from here to there.
how we get from here to there.
The Context
So often the
changes in how we see and measure hockey are compared to the same process of
change in baseball – no doubt because of the fame of Sabremetrics and the now
institutionalized narrative ofBrad
Pitt Billy Bean being more handsome adaptable than his contemporaries.
Deadspin recently compared shot-based metrics like corsi to baseball measuring on-base percentage, hinting at the mystery of what will come next.
changes in how we see and measure hockey are compared to the same process of
change in baseball – no doubt because of the fame of Sabremetrics and the now
institutionalized narrative of
Pitt
Deadspin recently compared shot-based metrics like corsi to baseball measuring on-base percentage, hinting at the mystery of what will come next.
Deadspin was talking about the latest victory claimed by data
analysts, this one in the sport’s biggest and most intense spot light. A parade
of tweeting white guys with beards is still making its way past the homes of
Steve Simmons and Damien Cox, with a solidarity campaign of tinfoil hat-wearers
squatting on Mark Spector’s lawn with the goal of drowning every mention of
‘toughness’ in a chorus of boos. One imagines the placards – if they had made
placards – would be Vollman charts.
Though analysts are loathe to discuss it, it was just one
victory in a season where the losses mounted on other fronts. Nashville admitted in September they are using zone entries this season on the advice of
analyst Eric Tulsky, with coach Barry Trotz stating their intention to practice
carrying the puck in rather than relying on a dump-and-chase model. The research
shows that entries with control create more offence than those without (and
we’ve seen that all season from Travis’s work right here on JN). But the
confounds of zone entries are so numerous as to prevent much work beyond
counting at this point.
The Predators improved from 2.27 goals for per game last year
(29th) and the fewest shots per game in the league (26) to 2.51 goals
per game (21st) and the 23rd most shots per game (29). That 2.51
figure just happens to be the exact number of goals per game the team would have managed last year just by assuming healthy seasons for Fisher, Wilson, and Hornqvist at their respective
(not especially impressive) goal scoring paces that campaign. In other words,
Nashville’s scoring didn’t improve, just the health of their players did. Trotz
remains on the hot seat and scoring remains a problem. Worse, the team had 2.83
goals per game (8th) two seasons ago, before entries with control
were a (known and stated) priority.
Of course, it’s
not an analyst’s fault. Tulsky has a terrifically thoughtful interview here in which he notes that the data can only really point to areas to address with other methods – video and coaching, for instance. Moreover, the players were the ones on the ice and, as I said above,
the confounds are nearly innumerable when 36 skaters and a half dozen coaches
are all making choices in real time. The truth of zone exits and entries remain
fundamental to the game – having the puck is better than not having the puck.
Dump and chase only became a thing when player size, team tactics, and league
rules conspired to make the neutral zone an impossible jungle to cross. That
someone counted it doesn’t change our intuition about the game, or the responsibility of coaches to be aware of the nuances of their team.
It’s hardly a one-step forward, two-back process. The Soo
Greyhounds revealed some of their analytics work while talking about Oilers’prospect Darnell Nurse, and there are likely a host of teams at every level
adopting increasingly complex and data-intensive metrics.
Greyhounds revealed some of their analytics work while talking about Oilers’prospect Darnell Nurse, and there are likely a host of teams at every level
adopting increasingly complex and data-intensive metrics.
As Eric Tulsky noted in one of the links above – teams have
already made a major step into analytics. It’s the media that’s behind the
curve, and fans are largely in the dark about what’s happening behind closed doors (myself included, of course).
already made a major step into analytics. It’s the media that’s behind the
curve, and fans are largely in the dark about what’s happening behind closed doors (myself included, of course).
Linkages
There’s a boring old idea about how Canada’s economy can and
will develop from selling fur, trees, and coal to
manufacturing stuff through economic linkages. Hey, if we have the ore in our
ground, the theory goes, capitalists will totally invest in making the steel. And if we have the
steel, other capitalists will totally want to make tin cans out of that. No
doubt. Those are forward linkages. And once we have tin cans, we’ll want some
printed paper wrapped around them, requiring pulp and dyes and an ad company,
and we’ll want something inside them, requiring we grow some food and make a
factory to stick the food in the cans. Those are backward linkages.
Of course, it didn’t happen in Canada. Multiple generations of
Canadians are at most a few degrees of separation from the oil fields, having
already found the bottom of the lumber, fish, and wheat industries (among so
many others) in one way or another. While average Norwegians are millionaires from having oil, Canadians are just happy to be helping global energy companies set profit records. Since Mulroney, every politician has
fallen over the bodies of their forebearers in a hurried effort to fill a
standing order for cheap materials worldwide. After all, who doesn’t want to
sit on the board of Ivanhoe Energy? Or Barrick Gold? You don’t get that
invite by playing hardball.
But this is a hockey blog and your eyes are very nearly glazed
over. “Whaaa?” is a fair, if non-specific question at this stage.
Thanks for asking it.
over. “Whaaa?” is a fair, if non-specific question at this stage.
Thanks for asking it.
The point is this – to date, hockey analytics have been focused
on backward linkages. We already have a puck that can only be used to score by
one team at one time, and so we started counting. No analyst will tell you it’s
a surprise that we found that shooting pucks is correlated with having the
puck, or that having the puck is necessary for winning. The insights have been
smaller – who is good at that, what kinds of players are effective, and when
teams are hot or cold and due for a change of luck – while allowing single
individuals to track hundreds of players at once. No person could watch that
much hockey, and no single brain can be trusted to evaluate each of the players
involved even if they did. Up to now, analytics have helped to externalize, corroborate,
and objectify things we can (in theory) already see, helping us build bigger
patterns than our brains can recognize from watching the games.
Hockey came to
us as a complete product and we’ve built analytics to explain what we see. That’s
a backward linkage. Now, hockey analytics are waiting for their forward
linkages to develop.
us as a complete product and we’ve built analytics to explain what we see. That’s
a backward linkage. Now, hockey analytics are waiting for their forward
linkages to develop.
Hockey’s Forward Linkages
Counting shot attempts is the equivalent of selling liquified
natural gas (except for the whole ‘destroying the environment’ part). Sure, it’s not quite raw, but all we’ve really done is sort out
the useful stuff from the admixture. We can just keep shipping out boat loads
of shot data, trusting something gets done from it, and then buying back what professional hockey teams sell us – that they’ve carefully used analytics
to improve their club, but there are other ingredients (like how funny Chris Thorburn is) and they know best.
At some point we will want to form this data into some sort of structural
analysis about HOW to play the game. Not who did it well yesterday, but how to
do it well tomorrow.
analysis about HOW to play the game. Not who did it well yesterday, but how to
do it well tomorrow.
We know that crossing the blue line with control and just
shooting it is not effective at the NHL level. And yet, our data doesn’t quite say
that. If a machine that had never known the finished product of hockey created
a strategy using our data, it might weight that option very heavily. We know we
score closer to the net, and more often on rebounds than non-rebounds. But we don’t
have any detail about how to get there, and absolutely no way to account for the
opponent knowing those same facts as they defend.
Our Turing-Hockey Strategy would be very odd. Passing might look
like it does in rugby – skate until you can’t skate any further and then give
it to someone who can. Our data doesn’t tell us where defensive pressure zones
are or how to beat them. Watching Gretzky follow his intuition taught us that. Chicago,
St. Louis and Anaheim have very different positional organizations and yet
accomplish the same task of scoring more than the other team. All we can say
with our current data is that each is very good at having the puck. It nears a
tautology, in which teams winning while out-shooting the opponent is used as
evidence that out-shooting your opponent leads to winning. Perhaps both are outcomes
from something else entirely.
Which team the Jets should emulate can’t be answered with our
current variables. They should just out-possess, somehow, some way.
current variables. They should just out-possess, somehow, some way.
Hockey Analytics is waiting for forward linkages. We’re waiting
for data on how to play the game. And
from there, we might start teaching people that plausibly optimal way. Until
then, the direction of the hockey world remains unknown despite the victories of ‘Big Data’ over ‘Sports Writer Nonsense.’
for data on how to play the game. And
from there, we might start teaching people that plausibly optimal way. Until
then, the direction of the hockey world remains unknown despite the victories of ‘Big Data’ over ‘Sports Writer Nonsense.’
Recent articles from Kevin McCartney